Hi, is it possible for when date ranges are selected that the horizontal scroll bar resizes itself automatically? As it is right now if I select a date range for a year and a task takes 3 months, I can only see the first month.
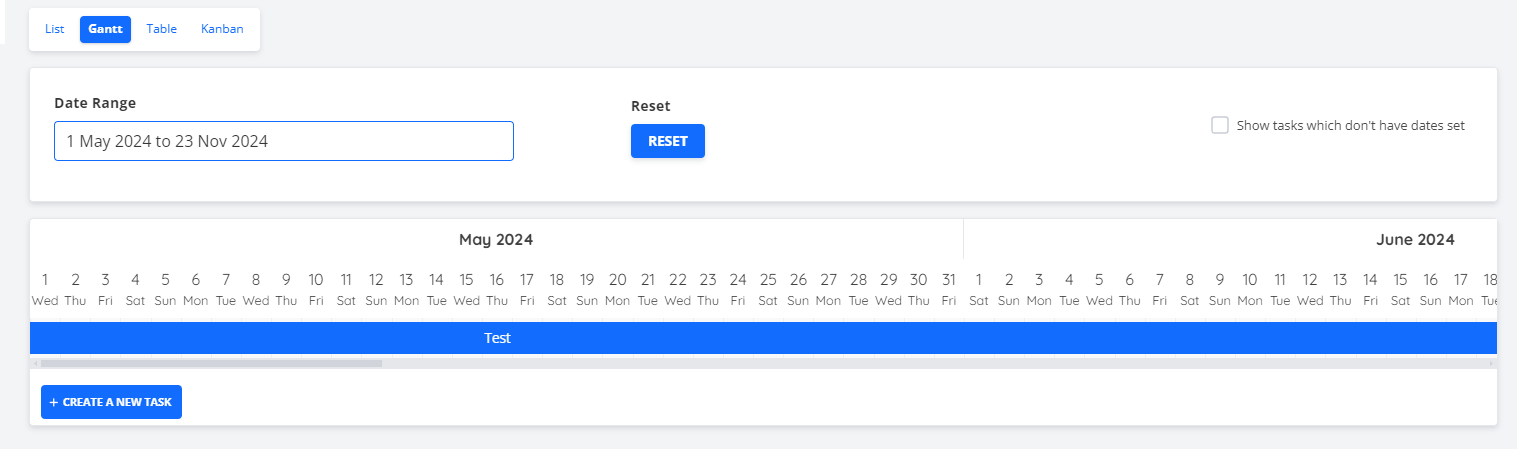
Do you mean the task should be always shown in full, even if it starts or ends outside of the current timeframe, or should it change the current timeframe when there is such a task?
1 Like
I think that it should be responsive and respond to the “Date Range” that was selected so that tasks can be easily visualised at a single glance for each temporal ‘slice’.
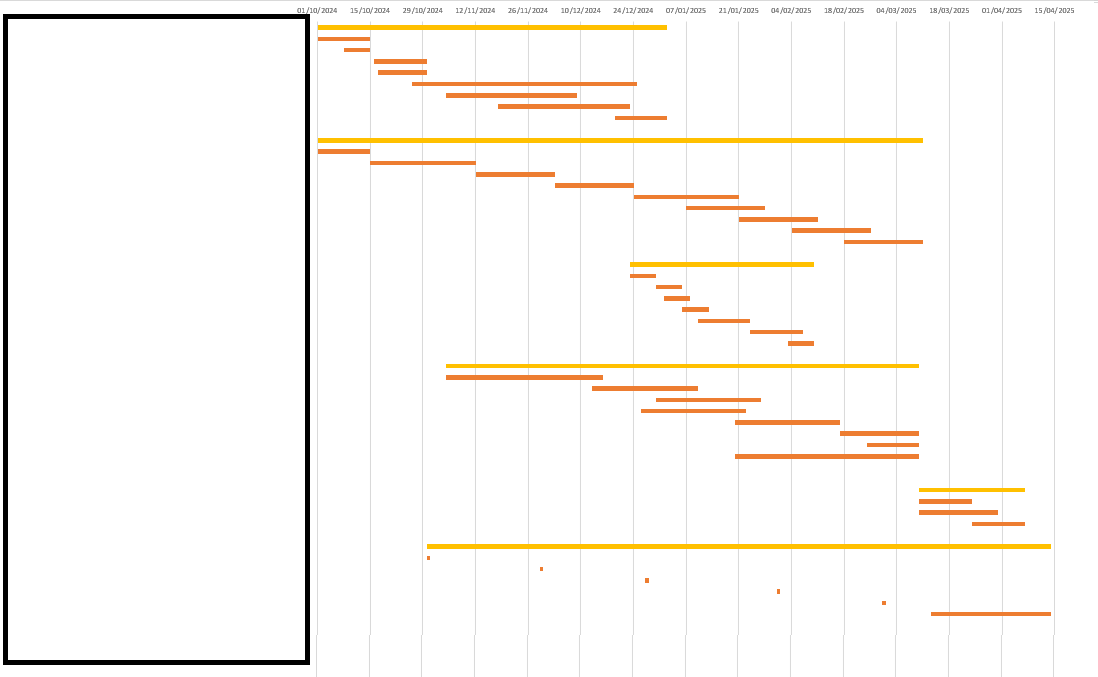
For example if one week were selected it shows that time period, 2 months, and so on. The x axis would need to be resized though to like 1 week or 2 weeks or more depending on the range otherwise it’ll all be squish together. Eg The image below is how I organise my Excel Gantt chart at the moment for a 6-month period. Looking at this it would be great if the entire timeline for the task could be summarised as a single time chart (for different work packages etc as in the yellow line in the image below), but I’m going off topic now.
4 Likes