After updating to the latest stable version of Vikunja (not sure which version I was on before), I’ve found that updating tasks appears to be much slower. I’m running on Synology DS1019+ NAS server using docker compose. My machine itself isn’t very good in the first place but previously this appeared to be running more quickly.
I’m wondering if there are any config settings I might have missed or a need to enable or disable caching or anything? Other calls appear to be pretty snappy so not sure what the issue could be or if it’s just expected.
For reference, I previously was seeing request times of like 3 or 4 seconds (I hadn’t really measured it before). Now requests are usually taking about 11, which is the reason I noticed in the first place since I have a custom Android frontend to manage my chores using a Vikunja board and it began to consistently time out when updating tasks so I had to update the timeout length.
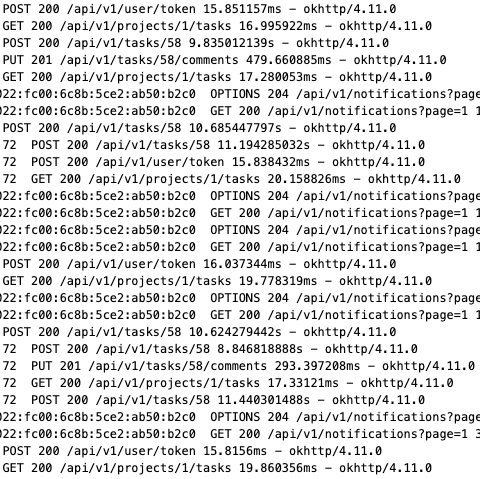
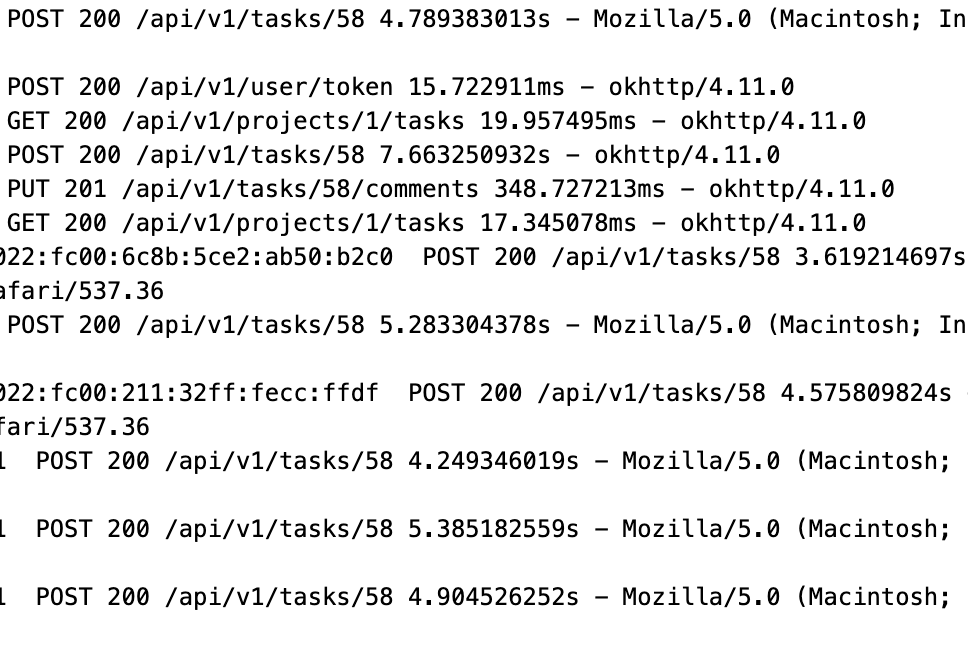
Logs of the slow calls (can see other calls that don’t take as long as well)
Thanks for any help anyone can provide! It’s a personal project so not a showstopper or anything, so please feel free to ignore if there are more important things to look into!
That’s definitely very slow. Updating a task should take no more than 100ms and usually around 40ms. This depends on the network connection between your device and the nas. Can you check if the nas itself is the problem or the network? To do that, in your browser, have the network tab open in the dev tools (F12), update a task, then look for the update request and do right-click → copy as curl. Then run the curl command in a shell on your nas. Is that slow as well?
So I think a large part of the problem was that me upgrading coincided with a monthly SMART test that was running and I didn’t notice. So rather than CPU bound, I might have been bound by the load on the disks themselves? This morning, the calls are a lot faster than yesterday from my PC using curl and from the app frontend I made.
Hitting the API from the NAS itself via curl appears to take just as long as from on my pc.
Since the calls are about as fast as they had been in the past, I think this is basically resolved.
That being said, because SMART impacted it so much, I think I’m going to try installing a read/write SSD cache with a couple of drives I have laying around to see if that helps. Then I can go from there to try to get to the baseline you’ve provided (100ms would be nice haha)
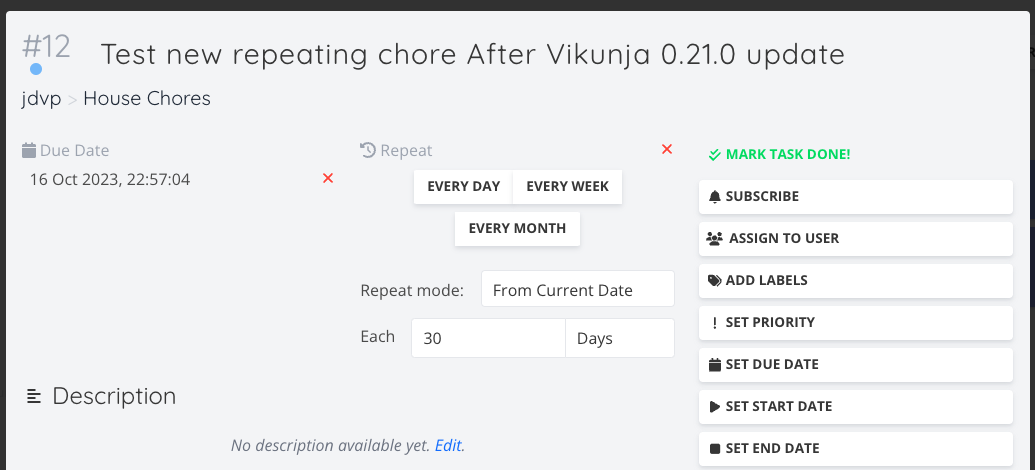
I know it’s been a bit on this but just recently I was trying to use the tasks endpoint to update the description on a task. I too experience a few seconds delay on that request, when all other requests are near instantaneous. What I noticed right after was that any other task on the same list got updated as well, as some of my other api calls which return recently updated tasks started returning super old tasks. My hunch is that my request is taking so long because the call is updating every task on the list. In my case it updated the description on the task i asked it to, but all other tasks on the list have a modified date with no changes to them.
Can you enable database logs and check the logs for one request to see if it’s really updating the other tasks in the same request?
Vikunja should update only the task you want to update, unless it’s recalculating ordering positions. In those cases, it shouldn’t update the timestamps associated with tasks.
Ok, I enabled database logging. There are thousands of these entries in my log (This is right after triggering an update to a task description, and I did no other actions in the tool):
2023-11-14T16:19:41.801740485Z: INFO [DATABASE] f18e[0m [SQL] UPDATE tasks SET position = ?, updated = ? WHERE (id = ?) [4.099688987411353e+09 2023-11-14 16:19:41 2955] - 1.088057ms
and these:
2023-11-14T16:19:43.863001464Z: INFO [DATABASE] 1529e[0m [SQL] UPDATE tasks SET kanban_position = ?, updated = ? WHERE (id = ?) [1.598046750166263e+09 2023-11-14 16:19:43 869] - 1.292803ms
I should also add that in my case, the description I’m sending is a URL to a gitea issue. So something like:
EDIT: I just tried it without sending a url but rather some simple text, and it still does it, so it being a URL is not likely related it seems.
The math does checkout a little bit too. I count 5800 or so of those updates and they are all at least a millisecond to sometime closer to 2ms, so that could explain why the request for me is close to 9 seconds
select count(*) from tasks where project_id = your id
Looks like that’s something I did not anticipate with the recalculation. It should only happen when you edit the task at the very first position, not for every task. And it should not update the updated timestamp.
Sorry I haven’t got around to this recently, I should be able to get around to more testing pretty soon. I actually just had this occur using the front end too. I created a task and updated a label, and it updated all the tasks on the list (data on the task didn’t change but their updated timestamps did)