That is correct, to be clear, I am using double quotes (") around my authurl no quotes surround my clientid/secret and no quotes surrounding scope.
EDIT: Here is my full (scrubbed) config FWIW, double checked my yaml to make sure it wasn’t a syntax issue as well:
service:
# The public facing URL where your users can reach Vikunja. Used in emails and for the communication between api and frontend.
publicurl: "https://vikunja.tld"
rootpath: "/etc/vikunja/"
customlogourl: 'https://img.url.tld/u/WOC13r.png'
log:
# A folder where all the logfiles should go.
path: <rootpath>logs
# Whether to show any logging at all or none
enabled: false
# Where the normal log should go. Possible values are stdout, stderr, file or off to disable standard logging.
standard: "stdout"
# Change the log level. Possible values (case-insensitive) are CRITICAL, ERROR, WARNING, NOTICE, INFO, DEBUG.
level: "DEBUG"
# Whether or not to log database queries. Useful for debugging. Possible values are stdout, stderr, file or off to disable database logging.
database: "stdout"
# The log level for database log messages. Possible values (case-insensitive) are CRITICAL, ERROR, WARNING, NOTICE, INFO, DEBUG.
databaselevel: "DEBUG"
# Whether to log http requests or not. Possible values are stdout, stderr, file or off to disable http logging.
http: "stdout"
# Echo has its own logging which usually is unnecessary, which is why it is disabled by default. Possible values are stdout, stderr, file or off to disable standard logging.
echo: "stdout"
# Whether or not to log events. Useful for debugging. Possible values are stdout, stderr, file or off to disable events logging.
events: "stdout"
# The log level for event log messages. Possible values (case-insensitive) are ERROR, INFO, DEBUG.
eventslevel: "DEBUG"
# Whether or not to log mail log messages. This will not log mail contents. Possible values are stdout, stderr, file or off to disable mail-related logging.
mail: "stdout"
# The log level for mail log messages. Possible values (case-insensitive) are ERROR, WARNING, INFO, DEBUG.
maillevel: "info"
typesense:
enabled: true
url: 'http://IP.ADDR:8108'
apikey: 'xyz'
cors:
enable: true
origins:
- "*"
backgrounds:
enabled: true
providers:
upload:
enabled: true
unsplash:
enabled: true
accesstoken: ...
applicationid: ...
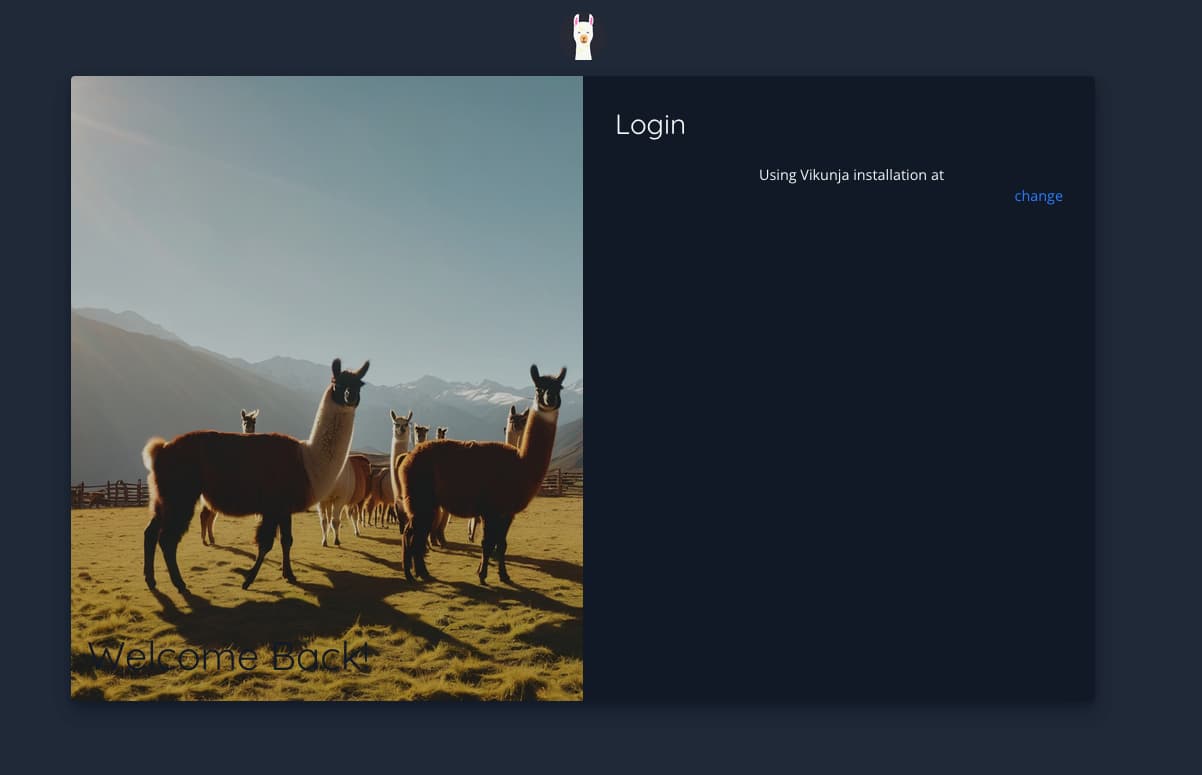
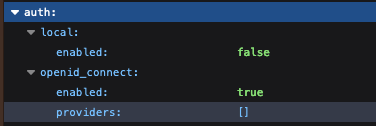
auth:
local:
enabled: false
openid:
enabled: true
# redirecturl: "https://vikunja.tld/auth/openid/"
providers:
authentik:
authurl: "https://authentik.tld/application/o/vikunja"
#logouturl: "https://authentik.tlk/application/o/vikunja/end-session/"
clientid: ...
clientsecret: ...
scope: openid email profile vikunja_scope
# Prometheus metrics endpoint
metrics:
# If set to true, enables a /metrics endpoint for prometheus to collect metrics about Vikunja. You can query it from `/api/v1/metrics`.
enabled: true
# If set to a non-empty value the /metrics endpoint will require this as a username via basic auth in combination with the password below.
username:
# If set to a non-empty value the /metrics endpoint will require this as a password via basic auth in combination with the username below.
password:
EDIT 2:
Reverted config to the old config to test:
service:
    # The public facing URL where your users can reach Vikunja. Used in emails and for the communication between api and frontend.
  publicurl: "https://vikunja.tld"
  rootpath: "/etc/vikunja/"
  customlogourl: 'https://img.url.tld/u/WOC13r.png'
log:
  # A folder where all the logfiles should go.
  path: <rootpath>logs
  # Whether to show any logging at all or none
  enabled: false
  # Where the normal log should go. Possible values are stdout, stderr, file or off to disable standard logging.
  standard: "stdout"
  # Change the log level. Possible values (case-insensitive) are CRITICAL, ERROR, WARNING, NOTICE, INFO, DEBUG.
  level: "DEBUG"
  # Whether or not to log database queries. Useful for debugging. Possible values are stdout, stderr, file or off to disable database logging.
  database: "stdout"
  # The log level for database log messages. Possible values (case-insensitive) are CRITICAL, ERROR, WARNING, NOTICE, INFO, DEBUG.
  databaselevel: "DEBUG"
  # Whether to log http requests or not. Possible values are stdout, stderr, file or off to disable http logging.
  http: "stdout"
  # Echo has its own logging which usually is unnecessary, which is why it is disabled by default. Possible values are stdout, stderr, file or off to disable standard logging.
  echo: "stdout"
  # Whether or not to log events. Useful for debugging. Possible values are stdout, stderr, file or off to disable events logging.
  events: "stdout"
  # The log level for event log messages. Possible values (case-insensitive) are ERROR, INFO, DEBUG.
  eventslevel: "DEBUG"
  # Whether or not to log mail log messages. This will not log mail contents. Possible values are stdout, stderr, file or off to disable mail-related logging.
  mail: "stdout"
  # The log level for mail log messages. Possible values (case-insensitive) are ERROR, WARNING, INFO, DEBUG.
  maillevel: "info"
typesense:
  enabled: true
  url: 'http://IP.ADDR:8108'
  apikey: 'xyz'
cors:
  enable: true
  origins:
    - "*"
backgrounds:
  enabled: true
  providers:
    upload:
      enabled: true
    unsplash:
      enabled: true
      accesstoken: ...
      applicationid: ...
auth:
  local:
    enabled: false
  openid:
    enabled: true
   # redirecturl: "https://vikunja.tld/auth/openid/"
    providers:
      - name: "authentik"
        authurl: "https://authentik.tld/application/o/vikunja"
        #logouturl: "https://authentik.tlk/application/o/vikunja/end-session/"
        clientid: ...
        clientsecret: ...
        scope: openid email profile vikunja_scope
# Prometheus metrics endpoint
metrics:
  # If set to true, enables a /metrics endpoint for prometheus to collect metrics about Vikunja. You can query it from `/api/v1/metrics`.
  enabled: true
  # If set to a non-empty value the /metrics endpoint will require this as a username via basic auth in combination with the password below.
  username:
  # If set to a non-empty value the /metrics endpoint will require this as a password via basic auth in combination with the username below.
  password:
and still no luck, I can confirm if I create an intentional syntax error (or accidental) I get the local login, and it shows in an error in config in the logs, and reverting to a default config etc.